
San Francisco — Lumen Energy, the modern solar broker partnering with leading real estate owners to turn their rooftops into new revenue, today announced the launch of the Lumen Solar Index — the first quarterly pricing benchmark for commercial and industrial rooftop solar leasing. The inaugural issue, covering Q2 2026, is available now and free to anyone.
The Lumen Solar Index arrives at a pivotal moment. Commercial solar leasing converts rooftops from a cost-center into an income-producing asset—more like adding a new paying tenant than a traditional sustainability project. At the same time, surging power demand from AI and data centers is pushing up power prices and making rapidly deployable power generation and storage more valuable to the grid. The problem is the market is still opaque: for the same roof, developers will bid dramatically different lease rates. For landlords evaluating a 20+ year lease, developer selection has become a consequential fiduciary decision. The Lumen Solar Index aims to shed light on this bid price spread, by major market, and by asset type.
As the solar broker running hundreds of bid processes a year for some of the nation’s largest real estate owners, Lumen sees — at scale and with precision — what developers offer, what owners negotiate, and which transactions actually close. The inaugural issue aggregates 1,849 bids and executed leases across four Tier 1 markets to produce a number the industry has long needed but never had: a transparent, methodologically consistent, citable benchmark for rooftop solar lease rates.

“The commercial rooftop solar leasing market has been flying blind. Owners sign long-term leases without knowing what comparable properties are getting, and developers price proposals without a true market reference. That gap costs owners real money and slows deployment. Lumen sits at the center of hundreds of unique transactions a year — we see the live bids, the negotiations, the signed leases. The Solar Index shares that intelligence with landlords, occupiers, brokers, appraisers, and developers alike.”
PETER LIGHT · CEO · LUMEN ENERGY
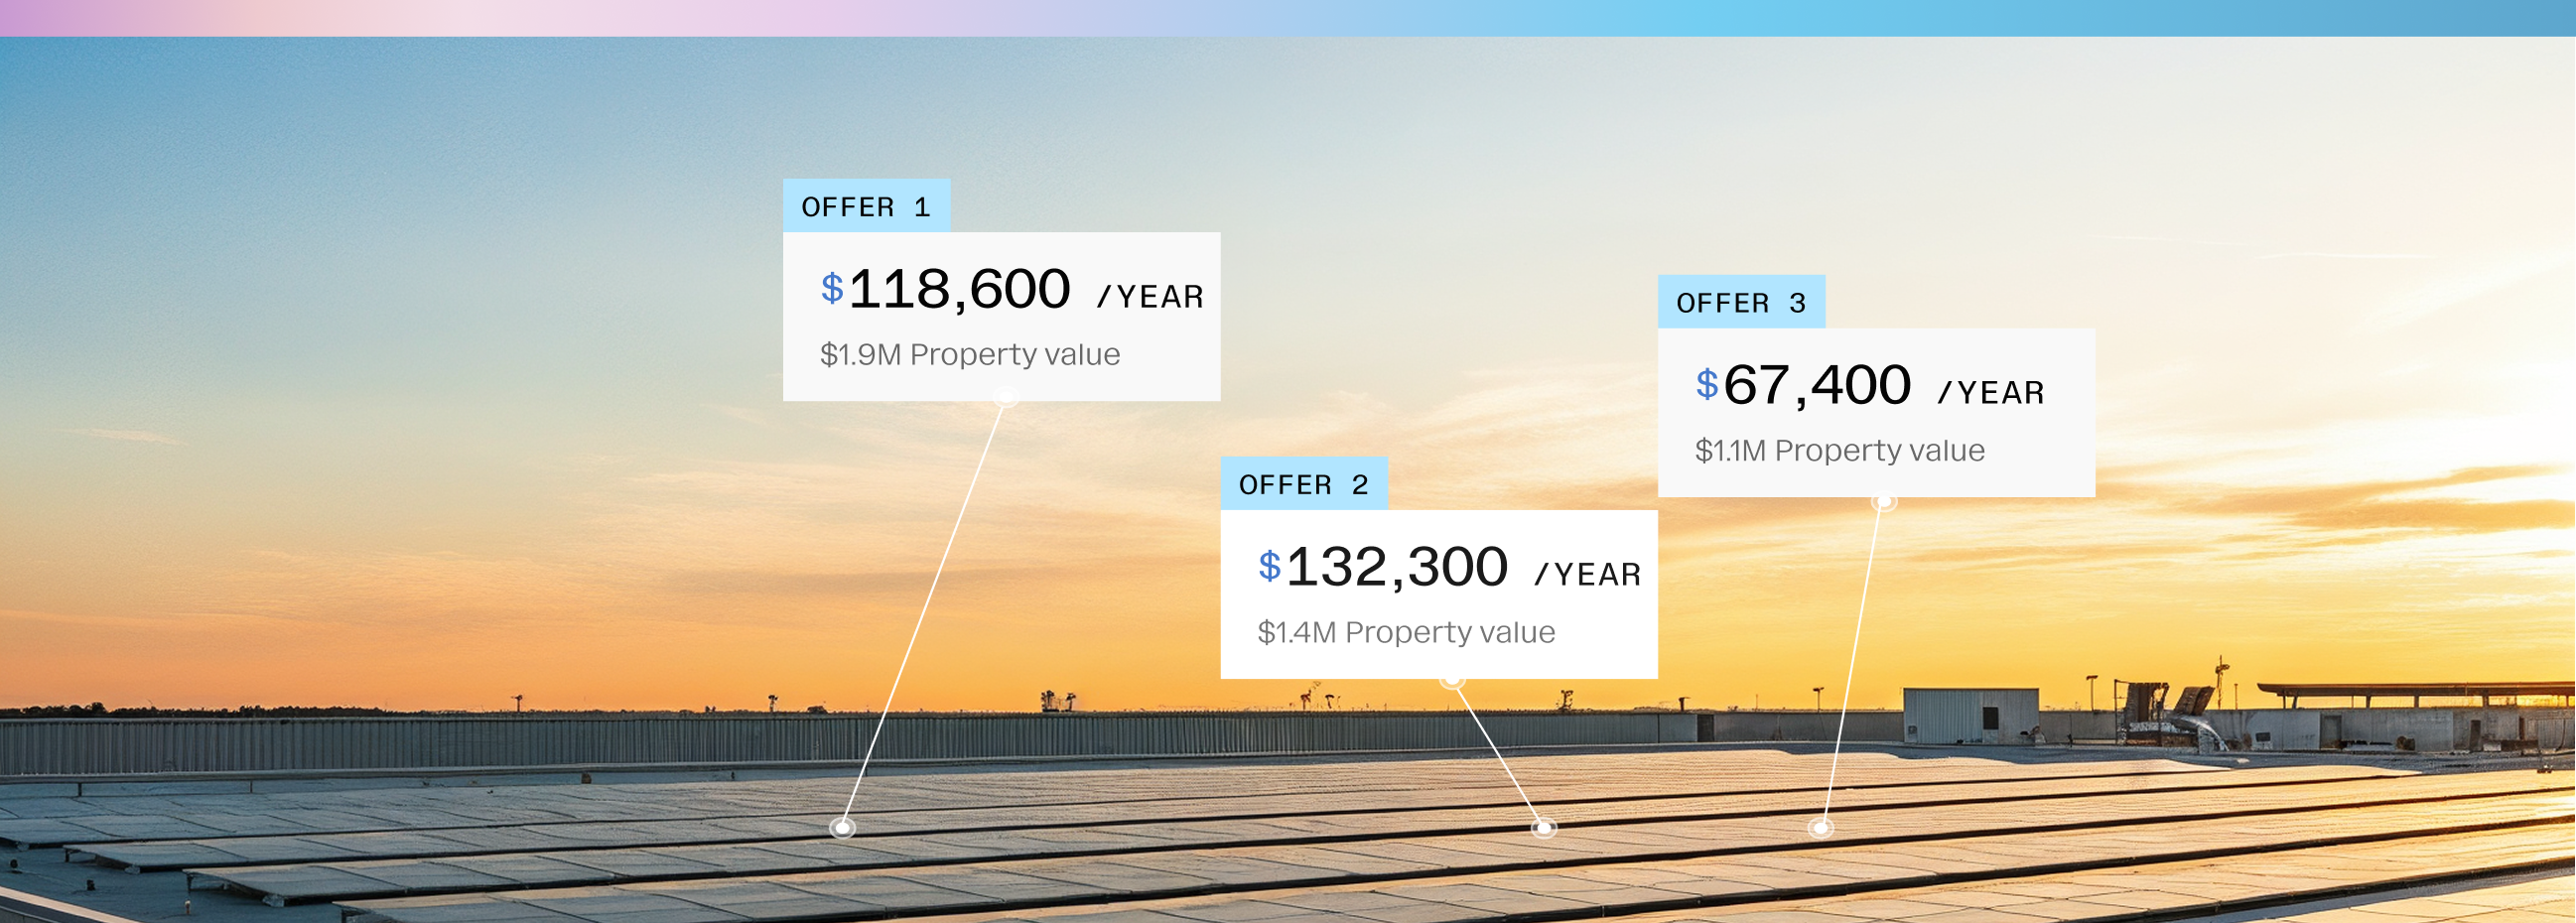
The same roof, bids that vary by nearly 3x
The inaugural Index’s most striking finding isn’t about geography — it’s about the developer pricing itself. Across the four Tier 1 markets, the same rooftop drew competing bids that varied by an average of 2.9x. Put plainly: an owner who accepted the first offer instead of running a competitive process could leave more than half the available value on the table.
Developers have very legitimate reasons for varying prices: they have distinct strategies for procurement, capital structure, utility interconnection, and policy & tax compliance. They take substantial execution risk, and make a long-term commitment to pay steady rent to landlords for decades across a wide range of possible futures on the grid. The ITC transition is another major driver: with the federal Investment Tax Credit phasing out, well-capitalized developers pre-purchased panels and transformers ahead of the deadline — a practice known as safe harboring — preserving tax-credit eligibility for projects starting well into 2027 and letting them keep offering competitive lease terms, while others are underwriting to tighter timelines and pricing accordingly.
KEY FINDING — LUMEN SOLAR INDEX, Q2 2026 INAUGURAL EDITION
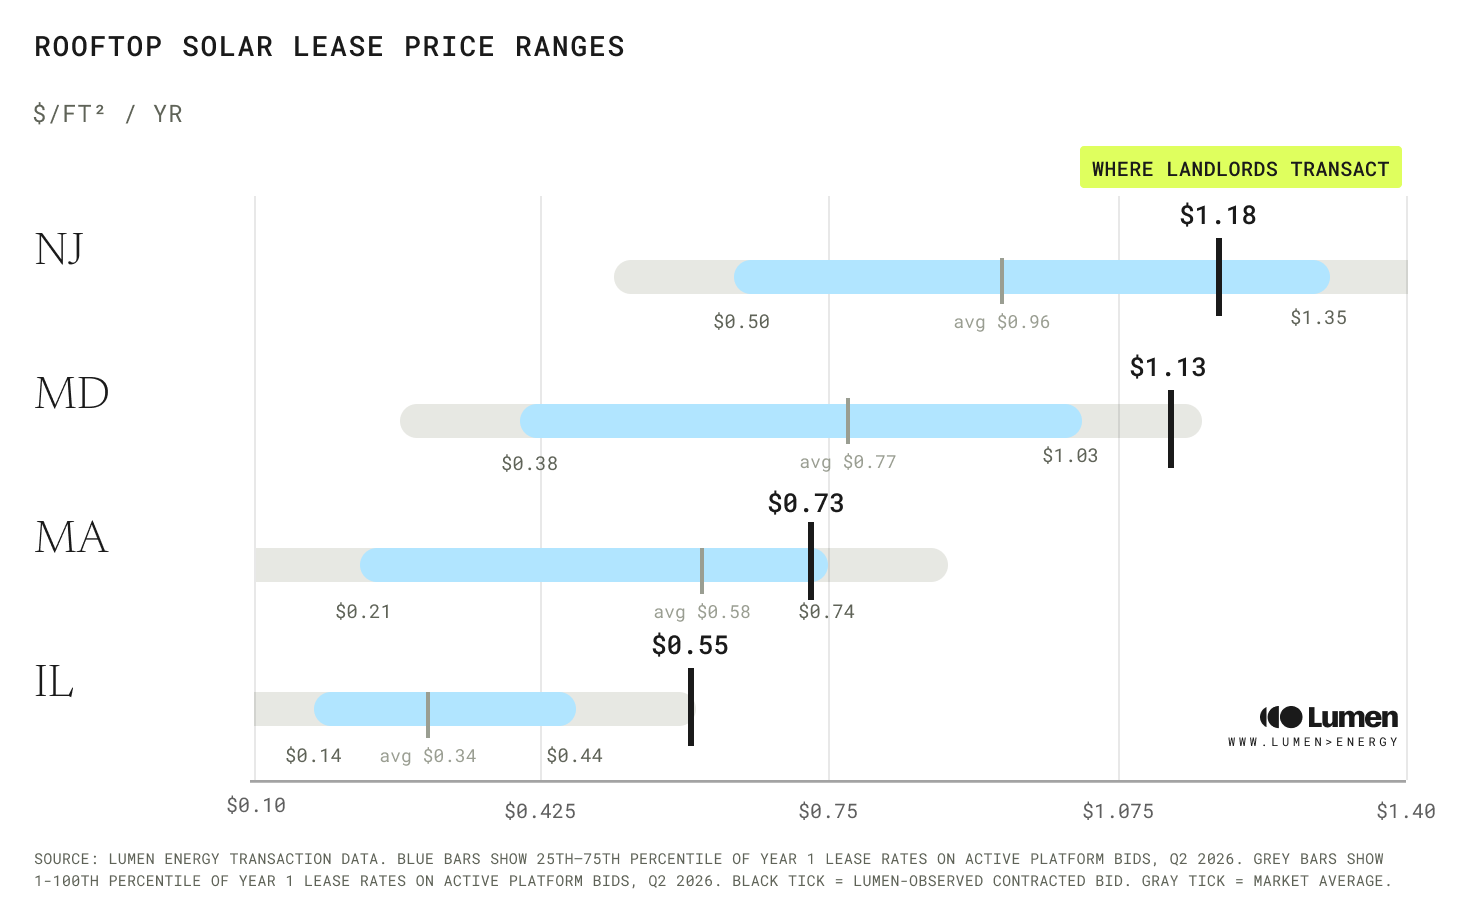
Across the four Tier 1 markets, competing bids on the same rooftop varied by an average of 2.9x. New Jersey carried the highest average lease rate at roughly $0.96/ft²/yr, followed by Maryland (~$0.77), Massachusetts (~$0.58), and Illinois (~$0.34) — dispersion that owners without market data have no way to benchmark against.
The four markets also differ meaningfully. New Jersey held the highest average lease rate in the index this quarter, with bids ranging from $0.50 to $1.35/ft²/yr; Illinois averaged the lowest, at a $0.14–$0.48 range. But the wider story is the dispersion within each market: this quarter, choosing the right developer often mattered more than choosing the right market.
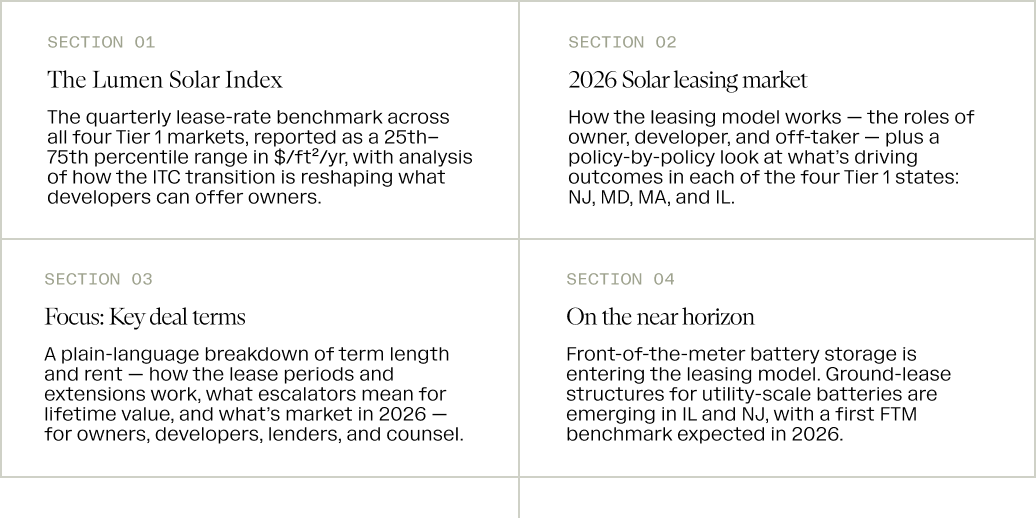
What the Index Covers
The Lumen Solar Index is modeled on the cadence of institutional CRE benchmarks — quarterly, methodologically transparent, and designed to be citable in a board memo or investment committee presentation. The report is structured in four sections:
The inaugural Lumen Solar Index is available now at lumen.energy/solar-index. Every quarter, the report will be refreshed with new transaction data and released.
ABOUT LUMEN ENERGY
Lumen Energy is the modern solar and battery broker, partnering with leading real estate owners to turn their rooftops into new revenue. We deliver rigorous portfolio analysis, create transparent competition among top developers, and provide white-glove service throughout. Our efficient, technology-backed approach gives owners clarity, confidence, and reliable returns — scaling clean energy without added complexity.
MEDIA CONTACT
Heather Stephenson
Lumen Energy
press@lumen.energy